📦
EUR 35bn
Total Exports to DE + FR + IT
Annual, Trademap data 2025
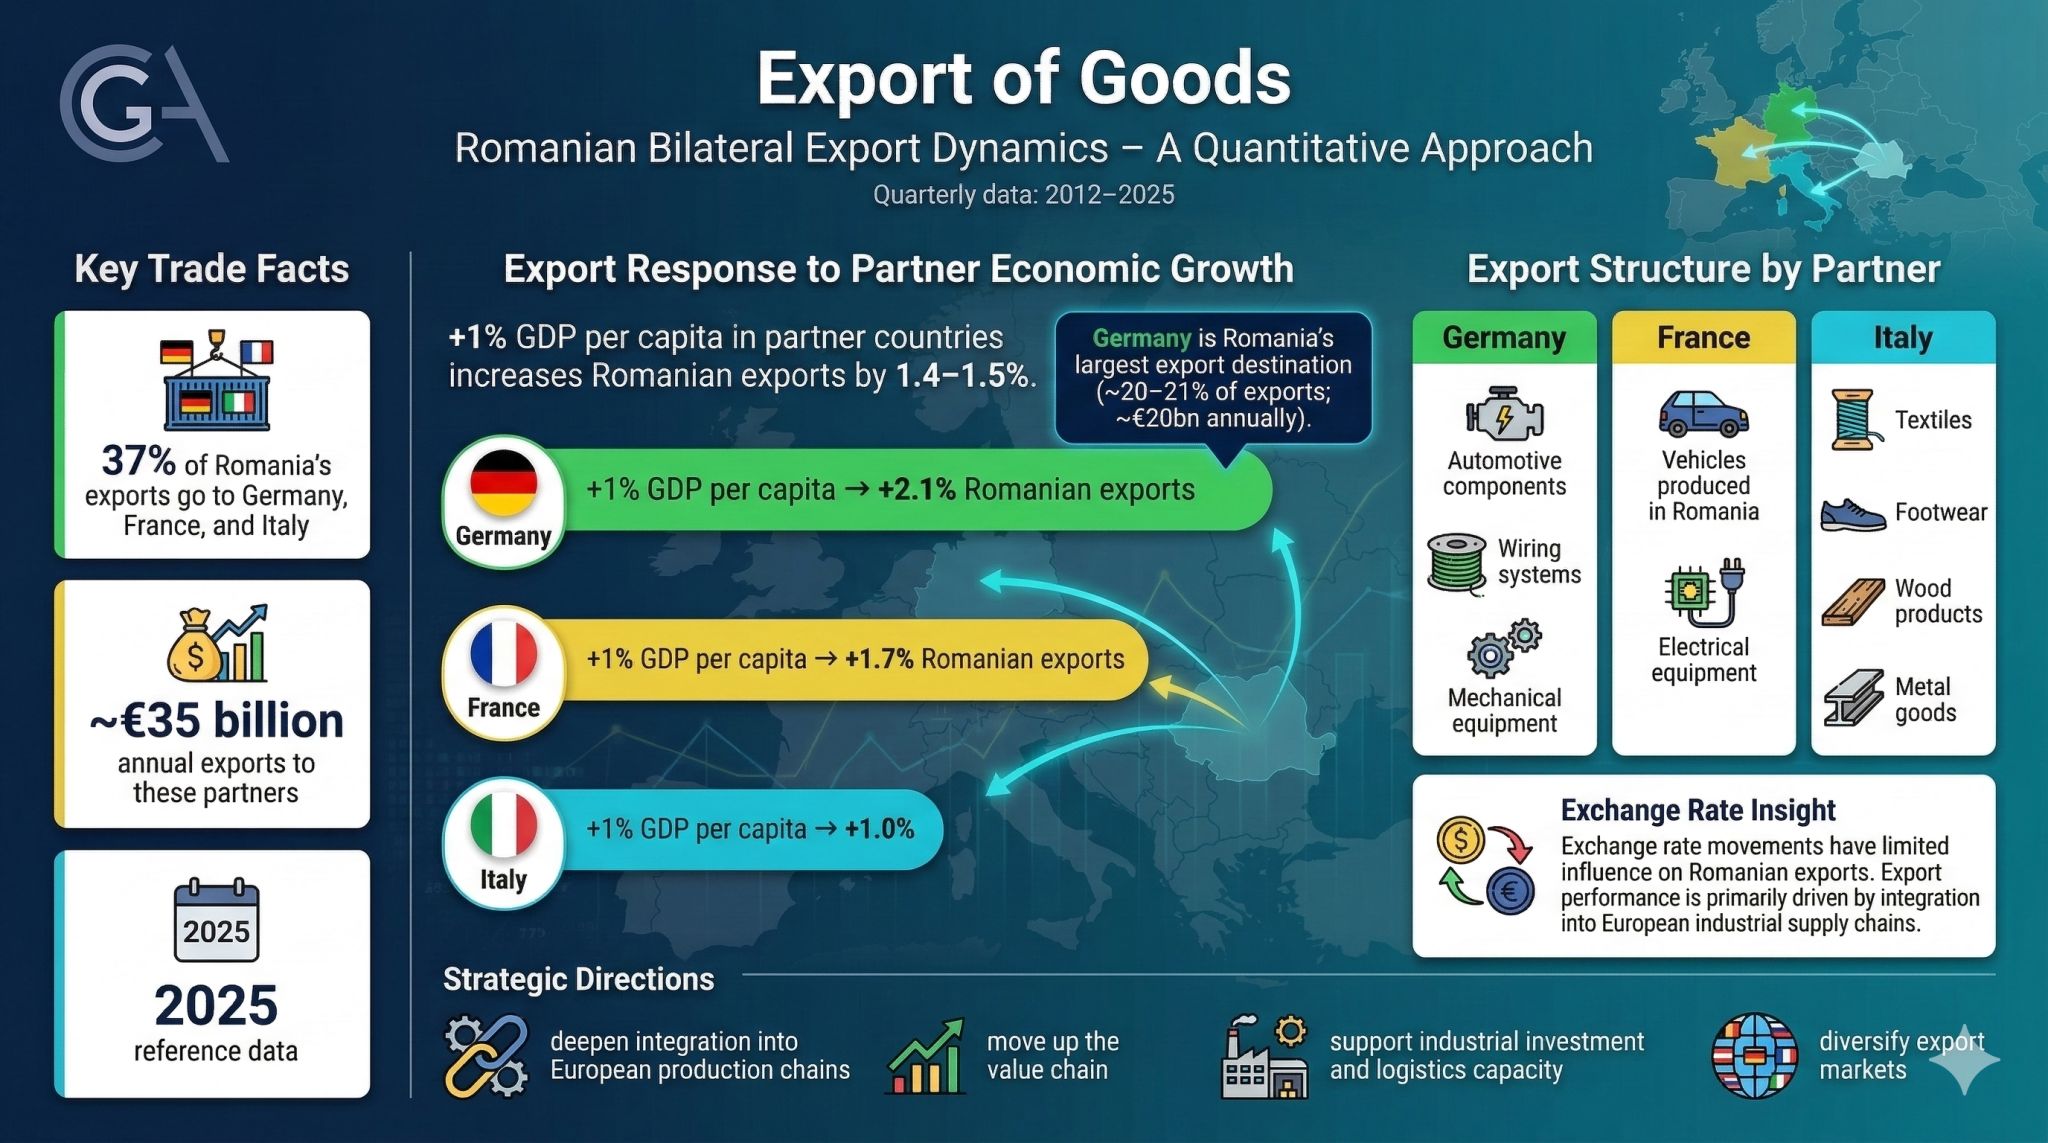
~37% of Romania's total goods exports
Three principal EU partnersA quantitative assessment of Romania's bilateral export performance with its three principal EU trading partners - Germany, France, and Italy - over the period 2012:Q1 to 2025:Q4.
By George Ștefan, Lead Researcher CPAG · Consilium Policy Advisors Group · office@cpag.ro · www.cpag.ro
📦
EUR 35bn
Total Exports to DE + FR + IT
Annual, Trademap data 2025
~37% of Romania's total goods exports
Three principal EU partners📈
1.40
Long-Run Income Elasticity
Panel ARDL - Theta(GDP) = -B₂/phi
A 1% rise in partner GDP per capita -> ~1.4% rise in RO exports
Statistically significant💱
0.35
Long-Run NER Elasticity
Panel ARDL - Theta(NER) = -B₁/phi
Short-run: ~0 (ARDL: 0.009, p = 0.986) - statistically insignificant
GVC integration effect⏱️
~30%
Quarterly Speed of Adjustment
Error-correction coefficient phi = -0.3064 (p = 0.000)
Trade imbalances corrected within approximately six months
Stable ECM mechanism confirmedNine sections - Data from Eurostat, Trademap - Quarterly panel: 2012:Q1-2025:Q4 - N = 3 cross-sectional units - T = 56 quarters - 168 total observations
Section 01
Research motivation and scope of analysis
Exports modelled as a function of partner-country GDP per capita and the nominal EUR/RON exchange rate. Balanced panel: N = 3, T = 56 quarters, 168 total observations. All data sourced from Eurostat.
Section 02
Short analysis of export structure
Germany: HS 85, 87, 84 - over 60% of bilateral exports, overwhelmingly intermediate goods. France: mixed - Dacia vehicles, electrical components, agri-food. Italy: traditional goods - textiles, footwear, wood products, iron and steel articles.
Sections 03-04
ADF unit root testing - Pooled OLS and Fixed Effects estimation
All series confirmed I(1) via ADF tests. Fixed Effects income elasticity: 1.5242 (p = 0.000), within R² = 0.830. F-test for poolability: F = 1317.7 (p = 0.000).
Section 05
Short-run dynamics and long-run equilibrium
Speed-of-adjustment phi = -0.3064 (p = 0.000). Short-run income elasticity: 2.6902 (p = 0.000). Long-run: theta(GDP) = 1.4042 - theta(NER) = 0.3449 (imprecisely estimated).
Section 06
Why NER elasticity is statistically insignificant
GVC participation lowers export elasticity to the real effective exchange rate by 22% on average (Ahmed et al., 2015). Romania's automotive export share of ~17% embedded in German supply chains explains the dampened exchange rate response.
Section 07
Partner-specific heterogeneity analysis
OLS with Newey-West HAC standard errors (4 lags). Income elasticity: Germany 2.067*** (R² = 0.896) - France 1.714*** (R² = 0.842) - Italy 1.035*** (R² = 0.784). NER coefficient insignificant across all three.
Section 08
Key findings and policy implications
Long-run income elasticity ranges from 1.0 (Italy) to 2.1 (Germany). Romanian exports amplify EU growth. Export competitiveness is driven by non-price factors, not by nominal exchange rate movements.
Section 09
Academic and institutional sources - Methodology
11 references including IMF, World Bank, ECB, and AER. Estimations in Python 3.12 using statsmodels (0.14) and linearmodels. All variables in natural logarithms for direct elasticity interpretation.
🇩🇪
Intermediate Goods Dominance
Key Insight - Germany
Romania's primary exports to Germany - insulated wire (wiring harnesses), transmissions, and circuit boards - are inputs into German manufacturing. This intermediate-goods character explains the high income elasticity (B = 2.07): when German industrial output expands, demand for Romanian-sourced components is amplified through the production multiplier. It also explains the insignificant (and negative) exchange rate coefficient, as the high import content of these exports neutralises the price competitiveness channel.
🇫🇷
Mixed Product Profile
Key Insight - France
The income elasticity of 1.71 is consistent with this mix: final vehicle demand is income-elastic (as a durable consumer good), while the intermediate-goods component behaves similarly to the German bilateral. The positive (though insignificant) exchange rate coefficient (0.66) may reflect the final-goods component, where price competitiveness matters more than in pure intermediate-goods trade.
🇮🇹
Traditional Goods Focus
Key Insight - Italy
The income elasticity of 1.03, barely above unity, reflects this composition: Italian demand for Romanian textiles and leather does not amplify with GDP growth in the way that German demand for automotive components does. These product categories have more stable, less income-elastic demand patterns - textiles and footwear are closer to necessities, and their trade is often driven by cost advantages and outward processing arrangements (lohn work) rather than by income-driven absorption.
1
Romanian exports respond strongly to economic developments in partner countries. A 1% increase in income per capita in main partner countries leads to an approximately 1.4-1.5% increase in Romania's exports. The effect is even stronger in certain bilateral relationships. Income elasticity: Germany: 2.07 | France: 1.71 | Italy: 1.03
2
Contrary to common perceptions, the study shows that exchange rate fluctuations play a limited role in the evolution of Romania's exports. Across all econometric models analyzed, the exchange rate effect is weak or statistically insignificant. Romania is deeply integrated into European industrial supply chains, particularly in sectors such as automotive and electrical equipment. Many exported products contain imported components, which reduces the competitive advantage from currency depreciation. Romania's exports depend more on industrial integration than on exchange rate competitiveness.
3
Germany: Industrial components (automotive parts, wiring systems, mechanical equipment) used as inputs in German manufacturing. France: Mix of final goods and components, notably vehicles produced in Romania and electrical equipment. Italy: Larger share of traditional and lower value-added goods (textiles, footwear, wood products, metal articles).
4
The analysis shows that when trade flows move away from their long-term trend, the adjustment toward equilibrium occurs relatively quickly. ~30% adjustment per quarter - Trade imbalances are typically corrected within approximately six months.
Conclusion 1
Across all specifications - panel FE, panel ARDL, and bilateral OLS - the income elasticity is statistically significant, greater than unity, and economically large. The long-run income elasticity ranges from approximately 1.0 (Italy) to 2.1 (Germany), with the panel estimates centering around 1.4-1.5. These magnitudes imply that Romanian exports are not merely tracking European growth but amplifying it, consistent with a deepening structural integration into EU production networks.
Conclusion 2
The NER elasticity is statistically insignificant in every specification except the static FE model (where it is significant only at 10%). The ARDL model finds near-zero short-run exchange rate pass-through and a modest, imprecisely estimated long-run effect. Romania's export competitiveness is primarily determined by non-price factors - supply-chain positioning, product quality, delivery reliability - rather than by nominal exchange rate movements.
Conclusion 3
Approximately 30% of disequilibria corrected each quarter, implying a half-life of approximately two quarters for adjustment to the long-run equilibrium - a speed that reflects the quarterly rhythm of commercial contracts, shipping cycles, and demand adjustments in European goods trade.
Conclusion 4
Germany stands out with the highest income elasticity, strongest model fit, and tightest supply-chain integration - suggesting that the German economic cycle is the single most important external determinant of Romanian export growth. The weaker relationships with France and Italy indicate more diffuse trade linkages and a larger role for other bilateral factors.
1.4-2.1
Income Elasticity Range
Romanian exports amplify EU growth cycles, with Germany showing the strongest linkage at 2.07.
~0
Exchange Rate Impact
Nominal exchange rate movements have near-zero effect on export volumes due to GVC integration.
30%
Quarterly Adjustment
Speed of error correction - disequilibria adjust with a half-life of approximately two quarters.
Strategic Conclusion
Romania's export trajectory is fundamentally bound to the growth performance of its core EU partners and to the depth of its supply-chain integration, not to nominal exchange rate movements. Exchange rate management - while important for macroeconomic stability - is unlikely to serve as a lever for export-led growth. Policy should focus on deepening GVC integration, improving product quality, and enhancing delivery reliability rather than relying on currency competitiveness.